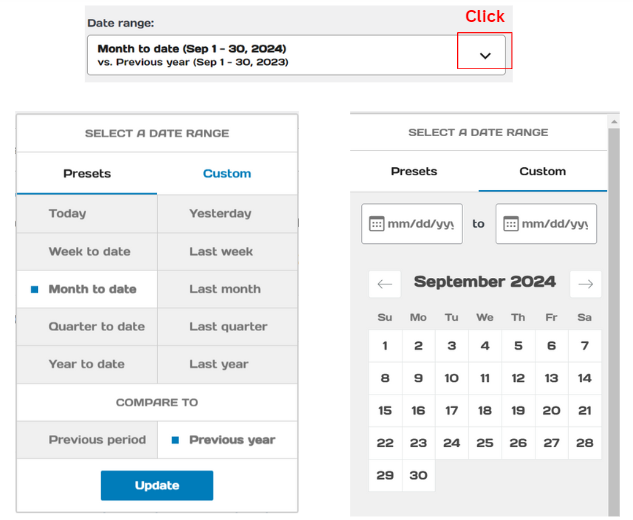
1. Begin by specifying the date range.

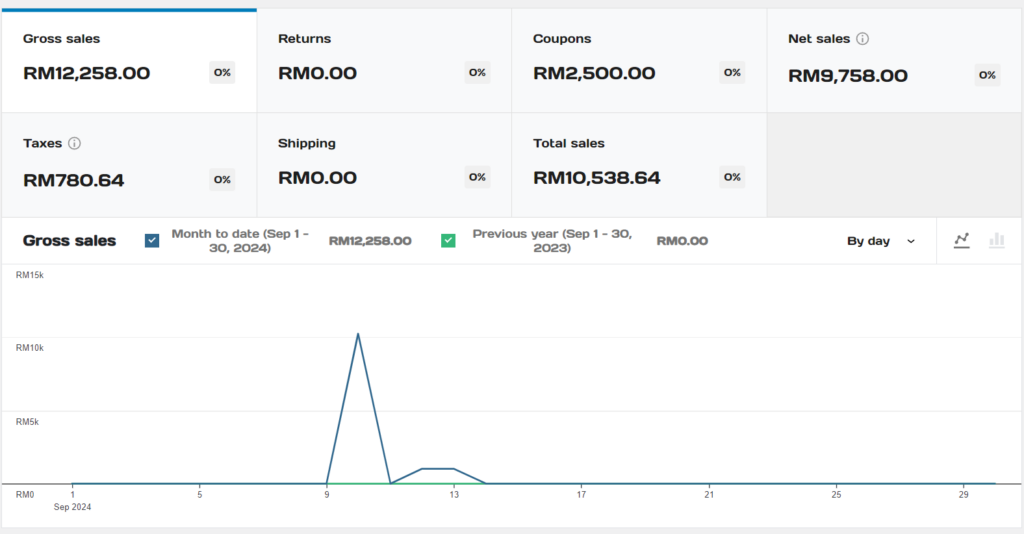
2. Details of the displayed revenue.

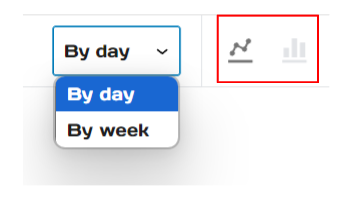
You can toggle between line charts and bar charts. Additionally, adjust the statistics to display by day or week by clicking the button below:

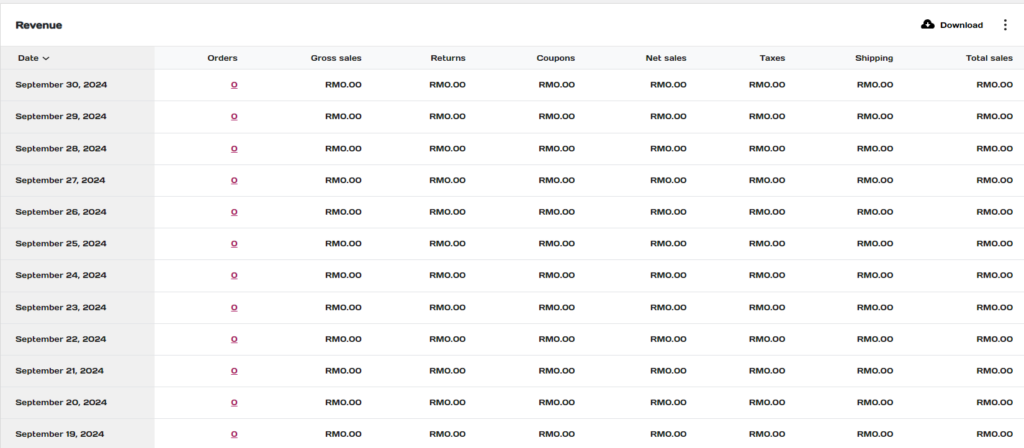
3. The revenue table displays the daily sales figures as well as the summary.


You can choose which columns to display in the table.

4. Download the report
You can download the report by clicking the ‘Download’ button. The system will then send the report to your email.


