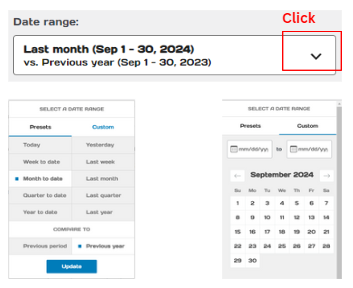
1. Start with setting up the date range
2. Select the option you’d like to view
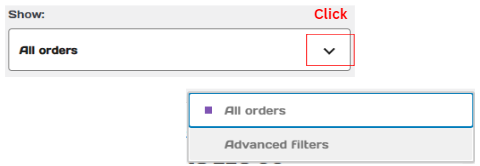
If you select ‘Advanced Filters,’ there are a few steps to follow :
– You need to choose and filter the categories you’d like to present
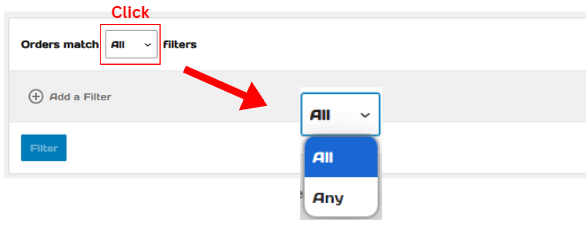
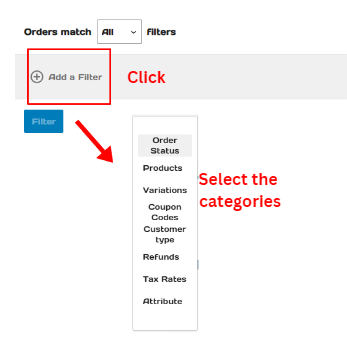
Then, the selected categories will display
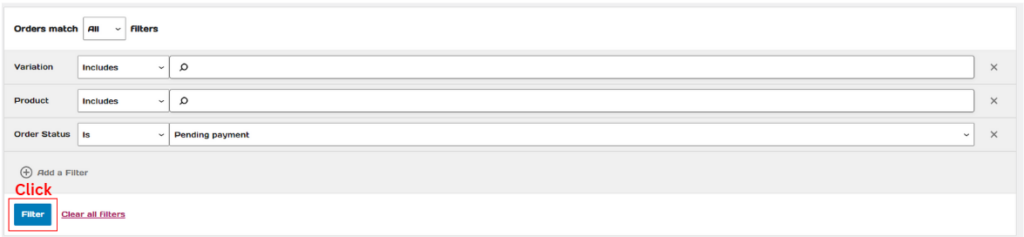
To see the results, click on the blue ‘Filter’ button at the bottom.
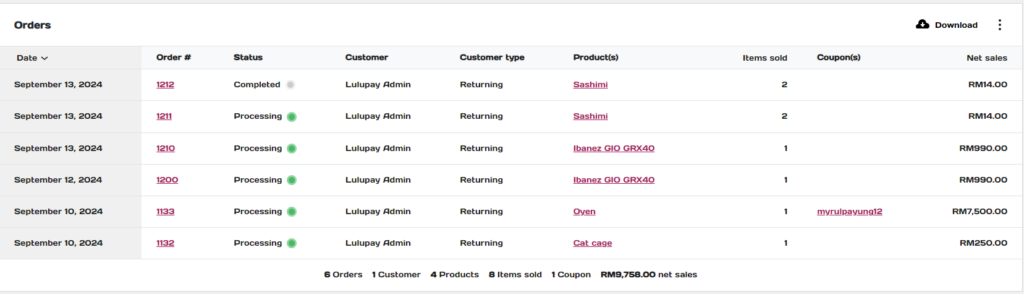
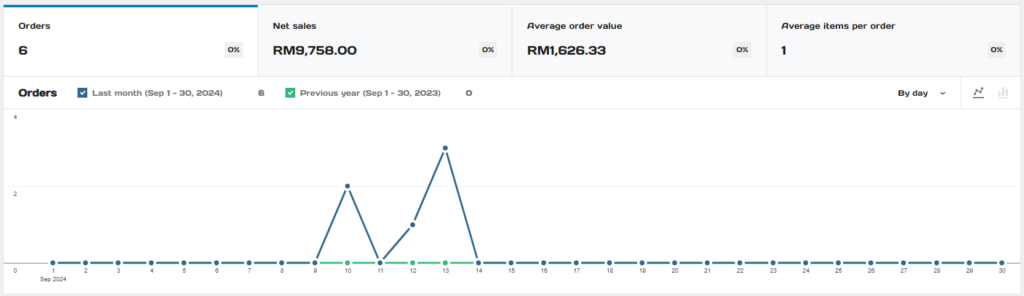
3. The overall statistics for all orders
4. A breakdown of details for each order