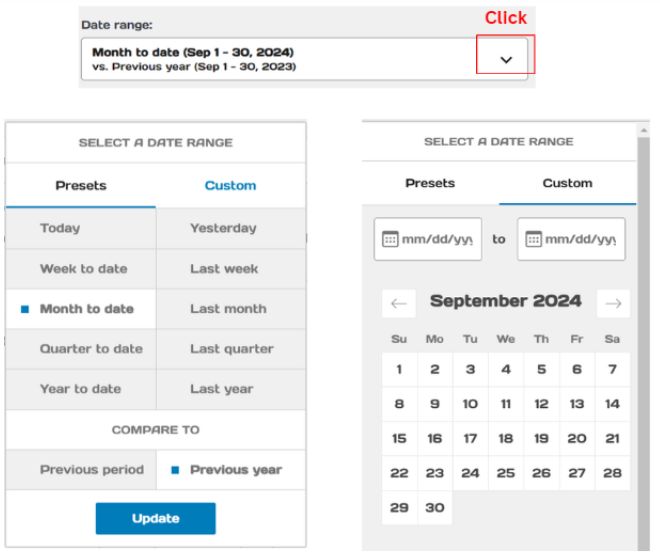
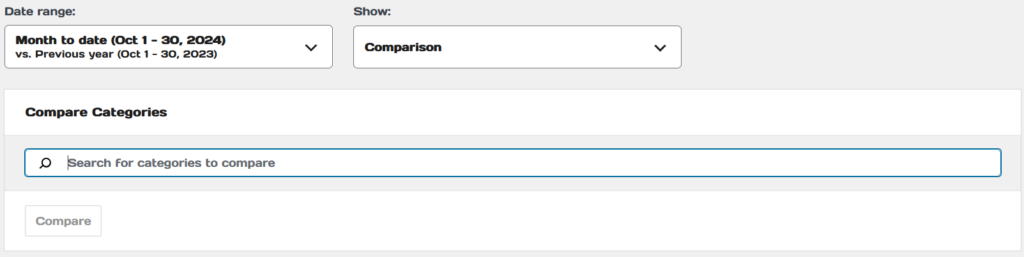
1. Begin by specifying the date range.
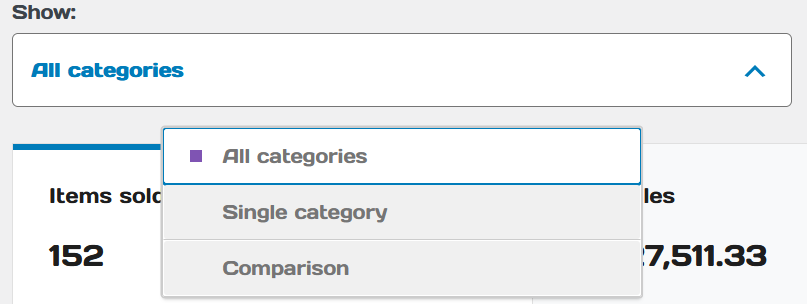
2. Choose Category
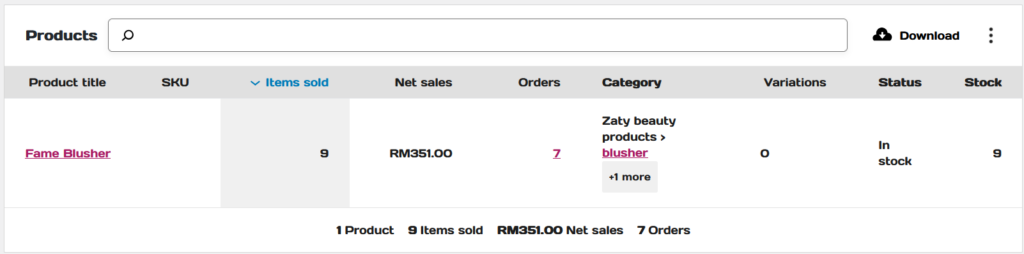
Example results of all categories
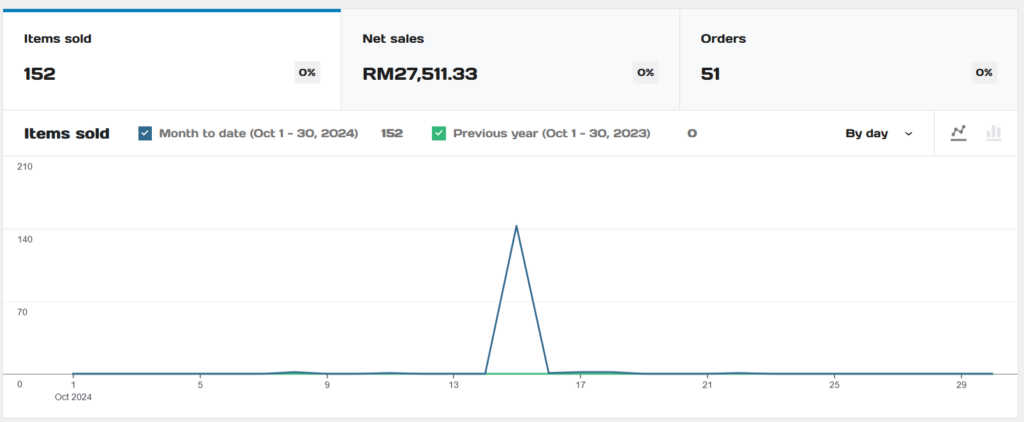

You may click “Download” to view in PDF Format.
Single Category #
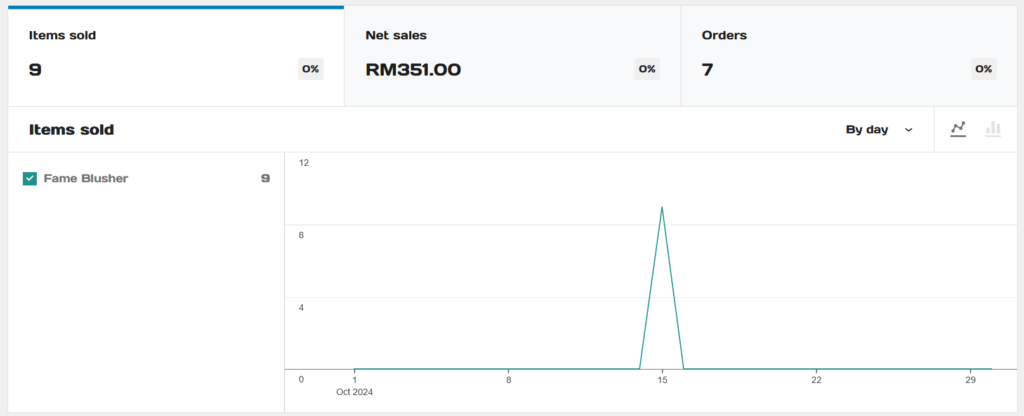
1. Once selected “Single Category”, search a category.
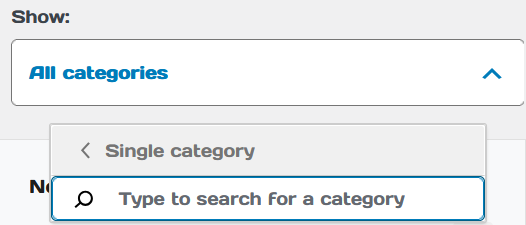
2. The image below illustrates the sale statistics of that category.
Comparison #
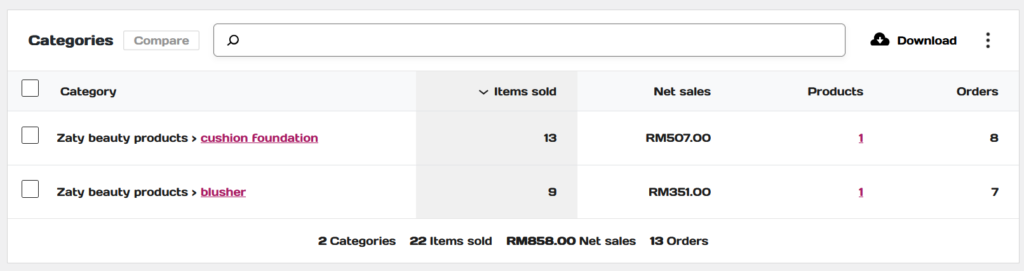
1. Once selected “Comparison”, choose two categories to be compared. Then clicked on “Compare”.
2. The images below illustrates an example of categories being selected and their statistics.
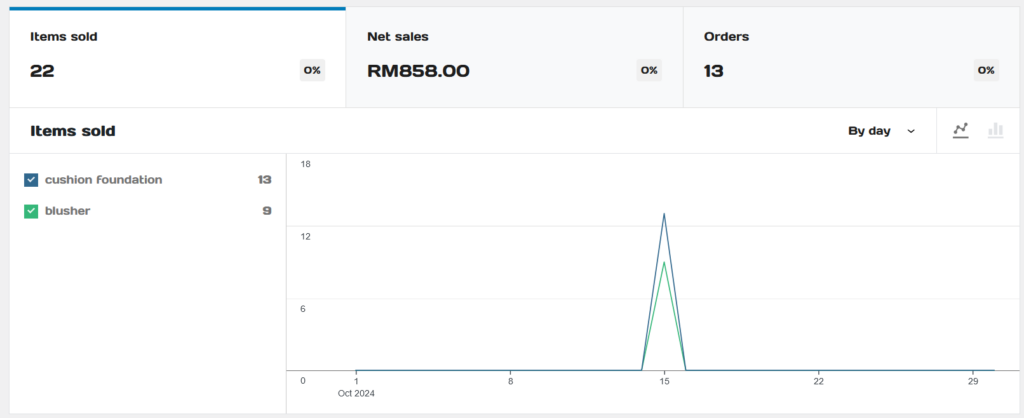
3. Click download to view statistics in PDF Format.