This segment shows a statistic about the product.
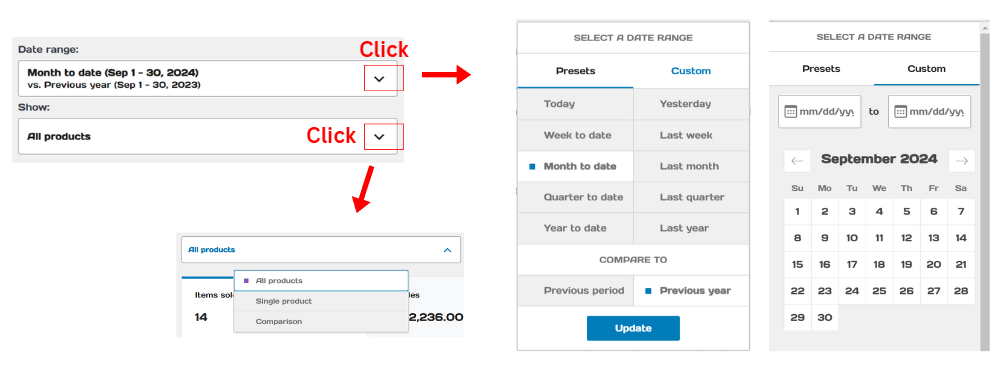
- Start with setting up the date range and the data you want to show.

2. The information will appear. There will be two types of charts which are line chart and bar chart. You can also set the chart to be displayed by day or week

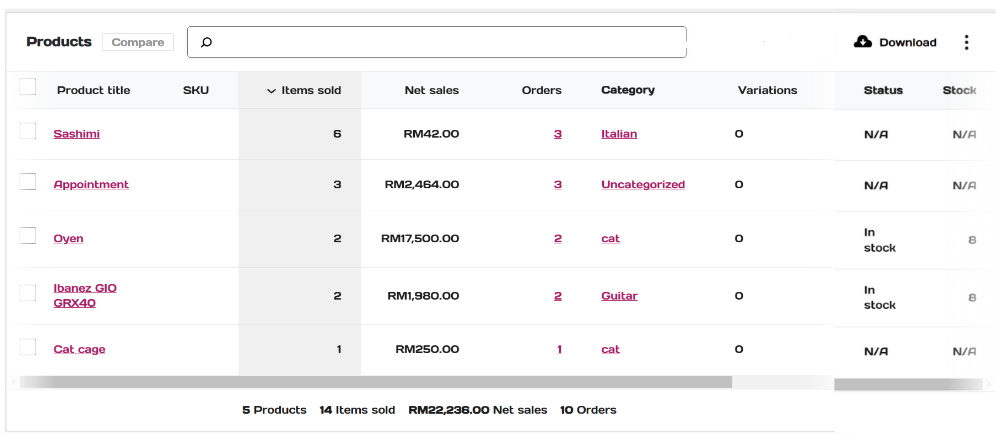
3. List of products sold :

The table show the list of products sold. It will show you the information and the status of the product.
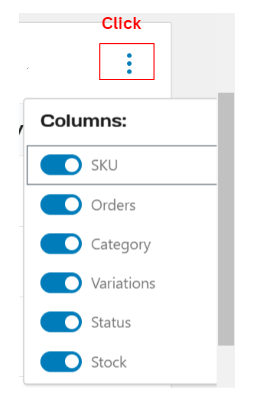
You can select the columns that you want to be showed in the table.

4. You can compare products by selecting any product via its checkbox and then clicking the ‘Compare’ button at the top of the table. The stats will then appear.


