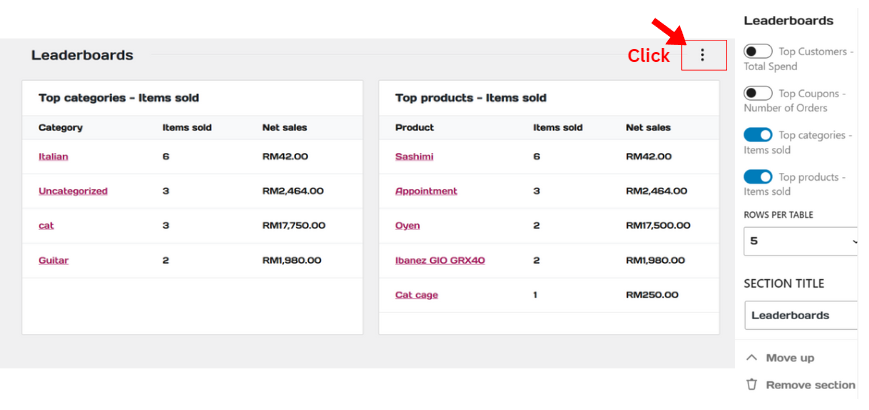
In LuluInsight, there are several segments to help you view business insights. The first segment is Overview, where you can access the performance metrics, charts, and leaderboards for the business.
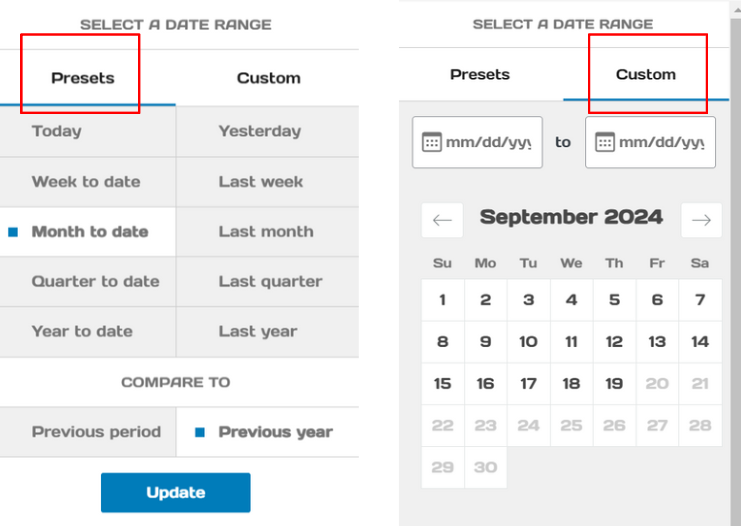
1. Set a date range for comparison.

You can set the date using the ‘Preset’ or ‘Custom’ option. After making your selection, click ‘Update’ to confirm.
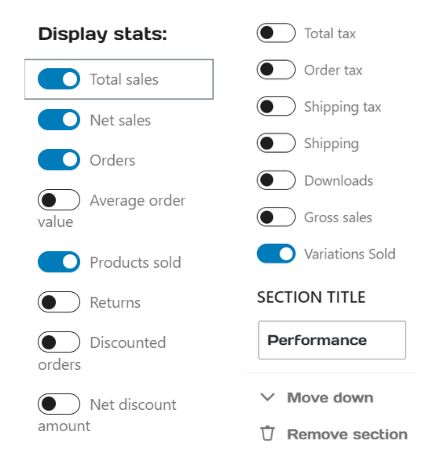
2. The ‘Performance’ section displays the business statistics.

You can select which business statistics to display by clicking the options button in the top right corner of the ‘Performance’ section.
3. The ‘Charts’ section offers two types of charts: line chart and bar chart. You can also configure the display to show data by day or by week.
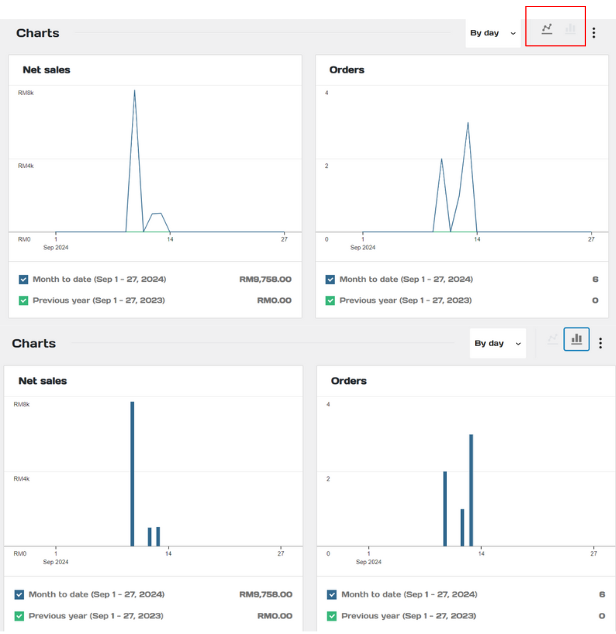
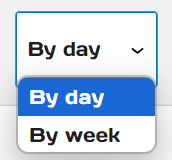
You can also select which statistics to display in the charts.
4. The ‘Leaderboards’ table displays the top categories, products, customers, or coupons for the business. You can choose which information to present using the options provided.
